

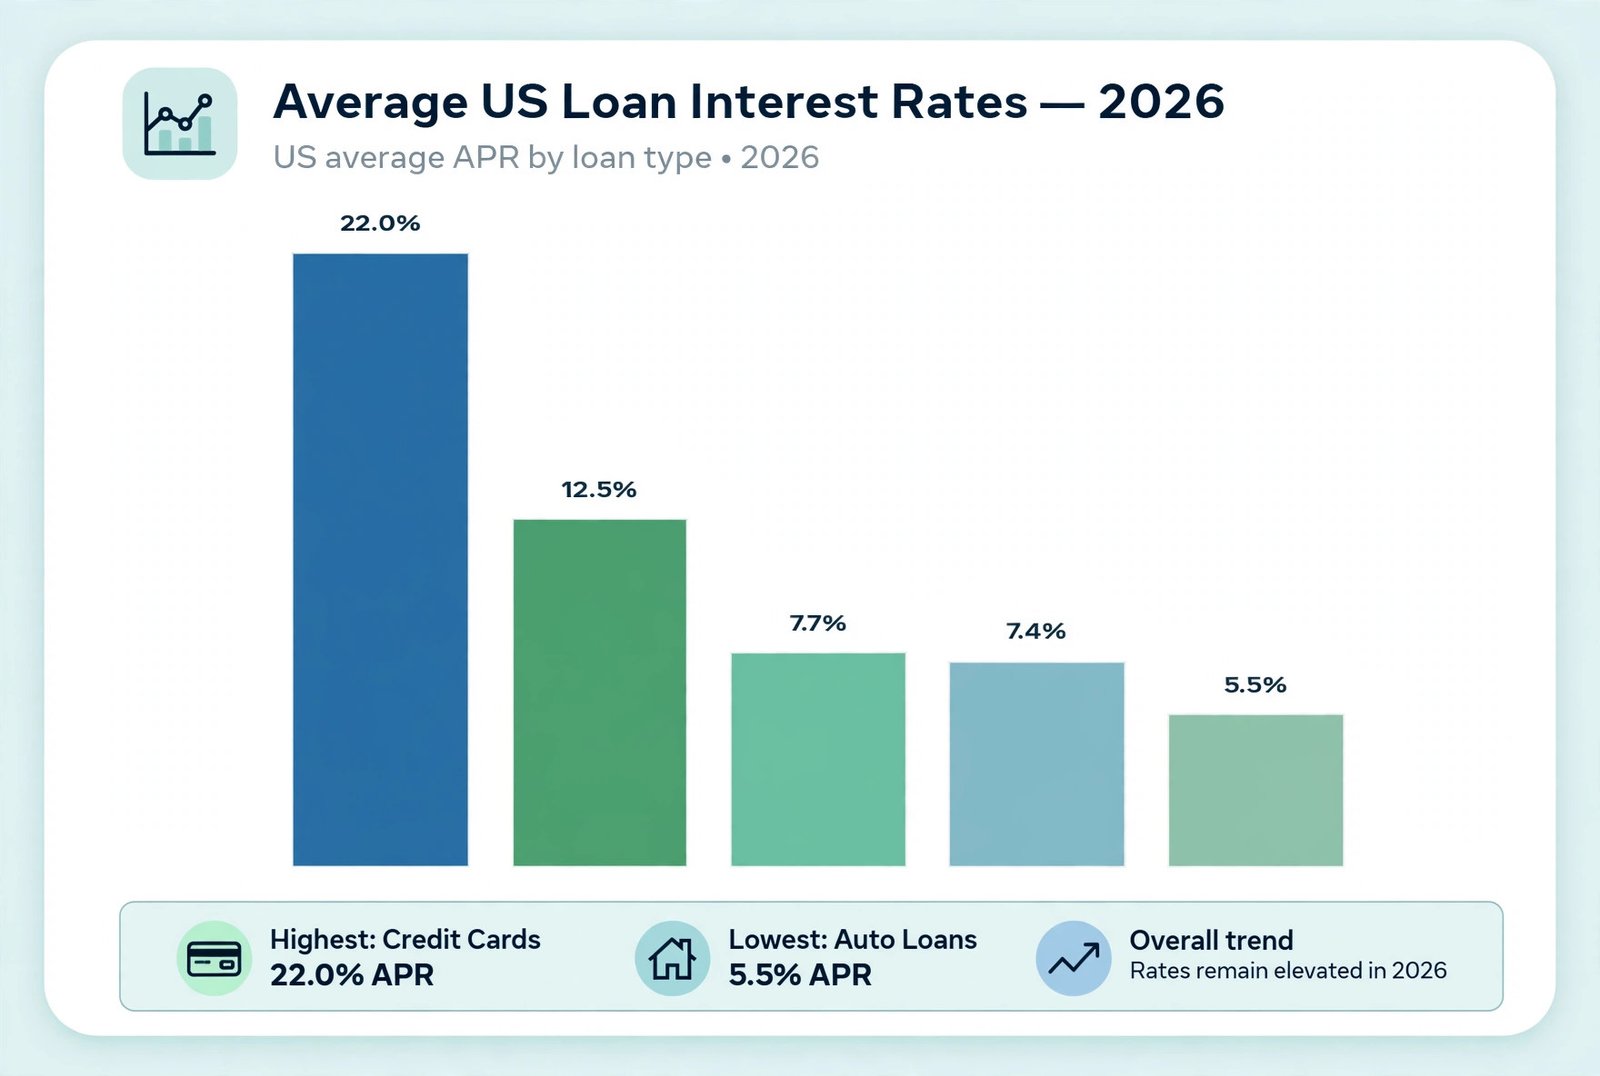
📊 Last updated: October 10, 2026. Averages from Bankrate, Freddie Mac, Federal Reserve, Credible, Curinos and Experian — published within last 30 days. Rates move daily; confirm with lenders directly.
What is a “good” interest rate right now? National averages give you a benchmark to judge any offer against.
Average Rates at a Glance (October 2026, USA)
| Loan type | Average APR | Source |
|---|---|---|
| Personal loan (3-yr) | 12.54% | Bankrate, Oct 2026 |
| 30-yr mortgage | 7.40% | Freddie Mac, Oct 2026 |
| Auto loan (new) | ~5.4% | MonitorBankRates |
| Credit card | 22.15% | Fed, Q2 2026 |
| HELOC | 7.33-7.67% | Bankrate, Oct 2026 |
How to Use These Numbers
- Benchmark every offer against these averages.
- Calculate total cost with our EMI Calculator.
- Check eligibility with Loan Eligibility Calculator.
What “Average” Actually Means (and What It Hides)
A national average is a benchmark, not a quote. The 12.54% personal loan average blends loans made to excellent-credit borrowers at single-digit rates with loans made to fair-credit borrowers at much higher rates. The same is true of every row in the table above: the average sits in the middle of a wide spread, and where you land inside that spread depends on your credit, income, debts, and the lender.
Three things an average hides:
- The distribution. Two borrowers can both be “near average” and still pay very different rates — one slightly above, one slightly below, with thousands of dollars between them over the loan’s life.
- The fees. Most published averages reflect rates, not the full APR with all fees. Two loans with the same average rate can cost different totals once origination fees are included — always compare APR, not just rate.
- The date. Averages move with the market. The table above is dated October 2026; a rate quoted to you in a different month will differ, sometimes noticeably. Treat the table as a compass, not a contract.
How Each Average Is Set
Each row in the table comes from a different market mechanism:
- Personal loans (12.54%): unsecured, so the rate is driven almost entirely by credit score and income. No collateral means the lender prices risk into the rate directly — which is why personal loan averages sit well above mortgage and auto averages.
- 30-year mortgages (7.40%): driven by long-term bond yields and Federal Reserve policy, surveyed weekly by Freddie Mac. Mortgage rates move more slowly than card rates but affect far larger balances, so small moves matter enormously.
- Auto loans (~5.4% new): secured by the vehicle, which lowers the rate versus unsecured loans. Manufacturer incentives and shorter terms also pull the average down.
- Credit cards (22.15%): unsecured revolving credit priced off the prime rate plus a large margin. Cards carry the highest average because the lender has no collateral and the borrower can draw and repay flexibly.
- HELOCs (7.33–7.67%): variable-rate lines secured by home equity, priced near prime plus a margin. The range reflects different draw periods, margins, and lender policies — and because the rate is variable, it moves when prime moves.
Why Your Offer Differs From the Average
Your personal rate is the average plus or minus your own risk profile. The biggest drivers:
- Credit score. Our lowest-rate guide shows the scale: on a $300,000 mortgage, 6.5% versus 8.5% means about $410 a month and about $148,000 over 30 years. A two-point rate difference from credit alone can dwarf every other factor.
- Secured vs unsecured. Our secured-vs-unsecured guide’s worked example puts numbers on it: $20,000 over 5 years costs $3,705 in interest secured (auto loan at 6.9%) versus $6,391 unsecured (personal loan at 11.5%) — a $2,686 difference for the same amount and term.
- Down payment and loan-to-value. More of your own money in the deal means less lender risk, which usually means a lower rate — and on mortgages, 20% down typically eliminates private mortgage insurance as well.
- Term. Shorter terms usually carry lower rates but higher payments; longer terms do the reverse. The rate difference between a 15-year and a 30-year mortgage is real money over the life of the loan.
- The lender. Banks, credit unions, and online lenders can quote rates a full point apart for the same borrower on the same day. The average cannot capture that spread — only competing quotes can.
How to Compare Your Offer in 4 Steps
- Find the right row. Compare a personal loan offer to the personal loan average, a mortgage offer to the mortgage average — never across rows. A 10% personal loan beats its average; a 10% mortgage would be far above its own.
- Compare APR, not just rate. APR includes most fees and reflects true cost. A lower note rate with high fees can lose to a higher note rate with no fees.
- Compute the total cost. Run the offer through the EMI Calculator linked above: monthly payment × months = total repaid. Compare totals, not payments — a lower payment over a longer term often costs more overall.
- Negotiate with the average in hand. “The national average for this loan type is X, and your offer is Y — can you match the average or waive the origination fee?” A written competing offer strengthens the ask further.
When These Averages Change
Averages move when the forces behind them move: central-bank decisions, bond market yields, inflation data, and lender competition all shift published averages over weeks and months. Credit card and HELOC averages move fastest (they track prime closely); mortgage averages move with bond markets; personal loan averages move with lender risk appetite and credit conditions.
This page’s table is dated October 10, 2026, and its own note says rates move daily. Before acting on any row, confirm the current figure with lenders directly — and if the table looks stale when you read it, treat it as a historical benchmark and get fresh quotes rather than borrowing against an old number.
FAQs
Average personal loan rate?
Roughly 12.5% (Bankrate, Oct 2026).
Average mortgage rate?
7.40% for 30-year fixed (Freddie Mac).
Average credit card APR?
22.15% (Federal Reserve).
How often do average loan rates change?
Daily for market-driven rates (mortgages, HELOCs), monthly or quarterly for surveyed averages (personal loans, credit cards). Published averages are snapshots — the table above is dated October 2026, and your live quote will differ.
Is the average rate the rate I will get?
Almost never exactly. The average blends excellent-credit and fair-credit borrowers. Your actual rate depends on your credit score, income, debts, down payment, term, and lender — it can sit well above or below the average.
Why is the credit card average APR so high?
Because cards are unsecured revolving credit with no collateral and flexible repayment. The lender prices that risk — plus the cost of rewards programs and defaults — into a prime-plus-margin rate that averages above 22%.
Why is the auto loan average lower than the personal loan average?
Collateral. An auto loan is secured by the vehicle the lender can repossess; a personal loan has no asset behind it. Our secured-vs-unsecured guide quantifies it: the same $20,000 costs $2,686 less in interest secured than unsecured over 5 years.
What is a HELOC?
A home equity line of credit — a revolving credit line secured by your home equity, with a variable rate that moves with prime. The table shows a range (7.33–7.67%) because margins and terms vary by lender.
Do these averages include fees?
Most published averages reflect interest rates, not the full APR with all fees. That is why this guide insists on comparing APR: fees can make two loans with the same average rate cost different totals.
Are these averages for fixed or variable rates?
It depends on the row. Mortgage and personal loan averages are typically fixed-rate figures; HELOC averages are variable; credit card APRs are variable (prime plus margin). Check the loan type before comparing your offer.
How do I get a below-average rate?
The same levers as our lowest-rate guide: improve your credit score, lower your DTI, make a bigger down payment, choose a shorter term, shop three or more lenders, and negotiate with written competing offers. Even half a point below average is worth real money on large loans.
Do average rates vary by state?
Yes — state regulations, lender competition, and local markets all shift rates. National averages are a starting benchmark; your state’s averages and your lender’s quotes are what actually apply to you.
Where do these averages come from?
The sources named in the table: Bankrate and Freddie Mac surveys, Federal Reserve data, and rate monitors such as MonitorBankRates, Credible, Curinos, and Experian — each publishing on its own schedule. That is why rows carry different dates: each source updates at its own pace.